
Vermont Public School Enrollment Trends
Statewide
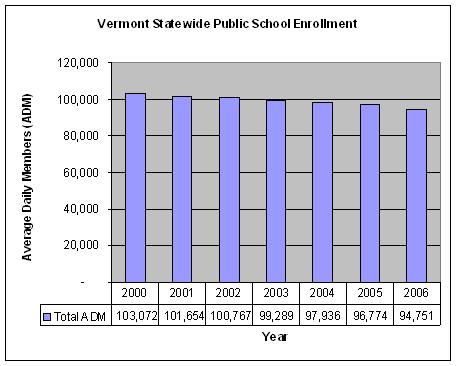
public school enrollment (as measured
by Average Daily Membership or ADM) has dropped by approximately 8.1%
from a
high of 103,072 in 2000 to a low of 94,751 in 2006.
The decline has been steady and consistent,
ranging from 1-2% per year. However,
this statewide trend does not hold true for each individual town. Over the same 2000
– 2006 time period, 20% of
Vermont
towns
have experienced an overall enrollment increase, 69% have experienced 2 or more
years
of enrollment increases, and 37% have experienced 3 or more years of
enrollment
increases. Only
10.7% experienced no
year-over-year enrollment increases.
Here is the same information presented in tabular form:
| FY |
Total
ADM |
%
change |
| 2000 |
103,071.67 |
|
| 2001 |
101,654.23
|
-1.4% |
| 2002 |
100,766.82
|
-0.9% |
| 2003 |
99,289.41 |
-1.5% |
| 2004 |
97,935.54 |
-1.4% |
| 2005 |
96,774.38 |
-1.2% |
| 2006 |
94,750.94 |
-2.1% |
Overall elementary enrollment has declined from approximately 54,004 in
2000 to 48,276 in 2006.
| FY |
Elementary |
%
change |
| 2000 |
54,004.03
|
|
| 2001 |
52,622.31 |
-2.6% |
| 2002 |
51,788.93 |
-1.6% |
| 2003 |
50,886.16 |
-1.7% |
| 2004 |
49,711.01 |
-2.3% |
| 2005 |
49,429.34 |
-0.6% |
| 2006 |
48,276.34 |
-2.3% |
Overall secondary enrollment has declined from approximately 49,067 in
2000 to 46,470 in 2006.
| FY |
Secondary |
%
change |
| 2000 |
49,067.64 |
|
| 2001 |
49,031.92 |
-0.1% |
| 2002 |
48,954.69 |
-0.2% |
| 2003 |
48,403.25 |
-1.1% |
| 2004 |
48,224.53 |
-0.4% |
| 2005 |
47,345.04 |
-1.8% |
| 2006 |
46,469.60 |
-1.8% |
Copyright (C) 2006 by Ken Dufort